|
Questions? E-mail us
or call us 302-584-1771, 8AM to 10PM U.S. East Coast Time 7 days a week
|
Bubble Chart Creator
|
Screen shots: 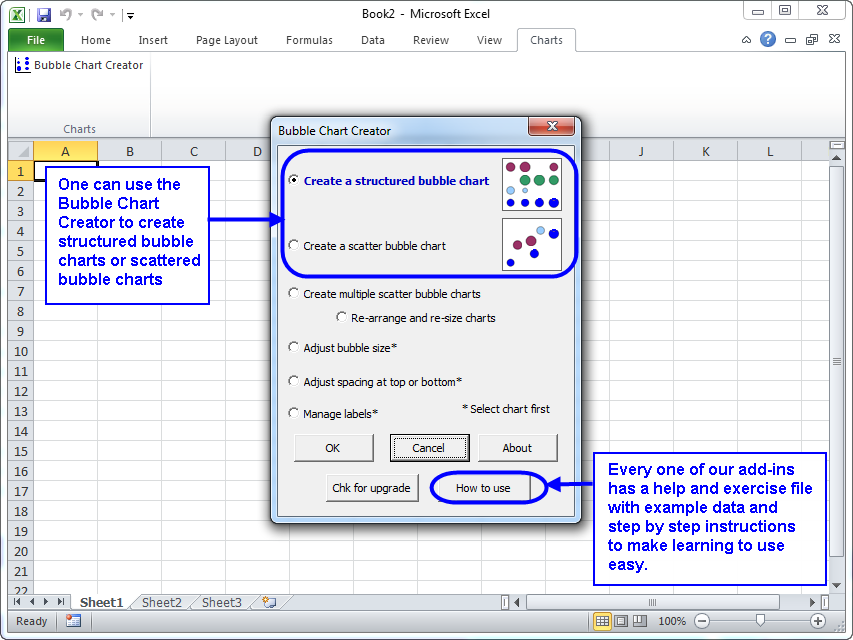 |
The Bubble Chart Creator add-in for Microsoft Excel makes it easy to create bubble charts, especially bubble charts from tables of data. It is compatible with Microsoft Excel 2010-2021 and Office 365.
The Bubble Chart Creator can easily create bubble charts from tables of values. It can also handle negative values. And, it can create charts that show three different dimensions of values. For example, if you had a table of data like the following:
The Bubble Chart Creator can easily create the following bubble chart, where the bubbles are organized in columns and rows:
Such a graph allows one to see both differences in market size by year by competitor without having a confusing set of lines or columns to study.
The Bubble Chart Creator can also create classical bubble charts, and gives you many options. The following chart illustrates one where each bubble is colored differently:
By adding individual color to each bubble, this adds a fourth dimension to bubble charts. And, the Bubble Chart Creator allows one to create bubble charts using date values for either the X or Y axis.
A great time saving feature of the Bubble Chart Creator is the ability to create many scatter type bubble charts at a time. You can easily create 10, 20, 40, or more bubble charts with just a few clicks.
Order online from our secure service. |
|
US $19.95 |
Customers who viewed the Bubble Chart Creator also viewed:
- Cascade Chart Creator - Create cascade charts that help you explain your data.
- Mekko Chart Creator - Create charts that show three dimensions of data
- Sensitivity Chart Creator - Easily create sensitivity or tornado charts.
- Waterfall Chart Creator - Create charts that compare quantity or volume to unit rates such as price/unit or profit per unit.
| Copyright 2024 Add-ins.com LLC, all rights reserved. Spreadsheet Assistant is a registered trademark of Add-ins.com LLC. |